
March was a stress test. The S&P 500 fell 4.9% on the month and is now down 4.4% year-to-date. Growth names got hit hardest — the Russell 1000 Growth is off 9.8% YTD. Energy was the only sector that worked in March, posting +10.2%. Healthcare, Staples, and Industrials each fell more than 8%. The market rotated fast and punished concentration.
Our Growth & Income strategy returned -6.1% in March and -2.5% YTD. Against a broad market down 4.4%, a dividend-focused, quality-tilted portfolio finishing ahead of the index after absorbing this kind of stress is the outcome the strategy is designed to produce. That's not spin — that's the construction working.
In a month where the Russell 1000 Growth fell nearly 10%, the G&I strategy is down 2.5% YTD. The gap is not luck. It's how the portfolio is built.
One detail worth noting: the G&I ETF outperformed the underlying strategy in March. Covered call income provided a cushion as the market sold off. That's the options overlay doing exactly what it's supposed to do — generating yield in flat-to-down markets and compressing drawdown when it matters most.
Our Tactical sleeve continued to be the standout, returning +4.1% YTD and outpacing the broad market by more than 800 basis points. Select Equity finished -4.6% YTD, tracking closely to the S&P 500 while outpacing the Russell 1000 Growth by roughly 500 basis points. Fixed Income and International Equity both posted modest positive returns — serving their role as stabilizers in a difficult environment.
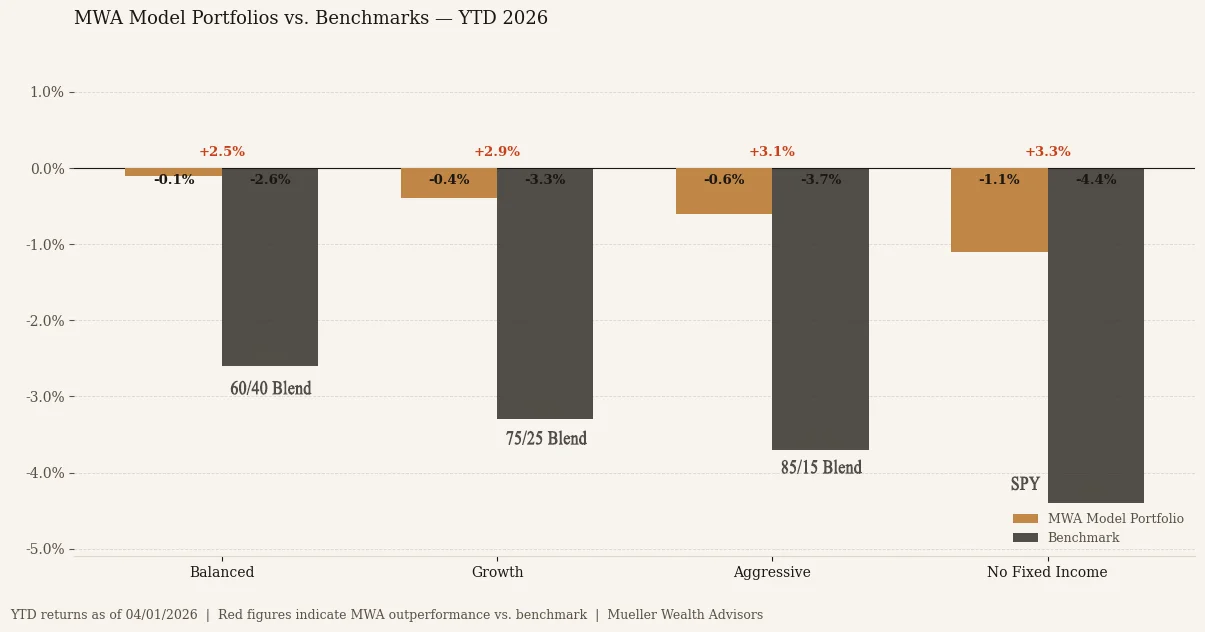
Every model beat its benchmark. The spread widened as equity concentration increased — meaning the active decisions in Tactical and the quality tilt in G&I are generating real alpha, not just tracking a benchmark.
Two moves defined Q1 positioning.
The first was trimming energy into strength. Names like CNQ and BKR had appreciated roughly 50% YTD heading into March. We reduced the overweight and rotated proceeds into Financials, Industrials, and select Technology — all of which had sold off sharply and, in our view, well beyond what the underlying fundamentals warranted.
The second was adding to software on AI disruption fears. The narrative driving the selloff — that AI would cannibalize enterprise software revenue — struck us as overstated in the near term and mispriced in specific names. Within our Growth & Income and Select Equity strategies, we added to BKNG, CRM, PANW, DDOG, and MSFT into the weakness.
The software selloff was driven by narrative, not numbers. We used it.
The valuation reset across these names was meaningful and, in several cases, historically significant.
MSFT is trading at a TTM P/E of approximately 23x and a forward P/E near 19.5x — well below its three-year average of roughly 34x. The market is pricing Microsoft as if AI integration is a structural headwind. We think that's wrong. Azure AI workload growth continues to compound, Copilot monetization is in early innings, and the balance sheet is among the cleanest in large-cap technology.
CRM has compressed to a TTM P/E near 21x — a number that would have been unthinkable two years ago for a platform growing mid-teens with expanding operating margins. PANW's forward P/E sits near 39x — elevated in absolute terms, but the platform consolidation thesis is intact and AI-driven security operations remain a structurally underpenetrated market.
DDOG reported Q4 revenue of $953 million against consensus of $919 million, with non-AI native growth accelerating for the third consecutive quarter. Full-year 2026 guidance of $4.06–$4.10 billion implies 18–20% growth. At a forward P/E of roughly 53x and a PEG ratio of approximately 1.0, it prices in a growth rate that is being consistently beaten.
| Name | Ticker | TTM P/E | Forward P/E | PEG | Key Metric |
|---|---|---|---|---|---|
| Microsoft | MSFT | 23x | 19.5x | 1.47 | 3yr avg P/E ~34x |
| Salesforce | CRM | 21x | 11.08x | 0.92 | Op margin expansion |
| Palo Alto Networks | PANW | 85x | 39x | 3.45 | Platform consolidation |
| Datadog | DDOG | 378x | 53x | 1.05 | Rev growth re-accelerating |
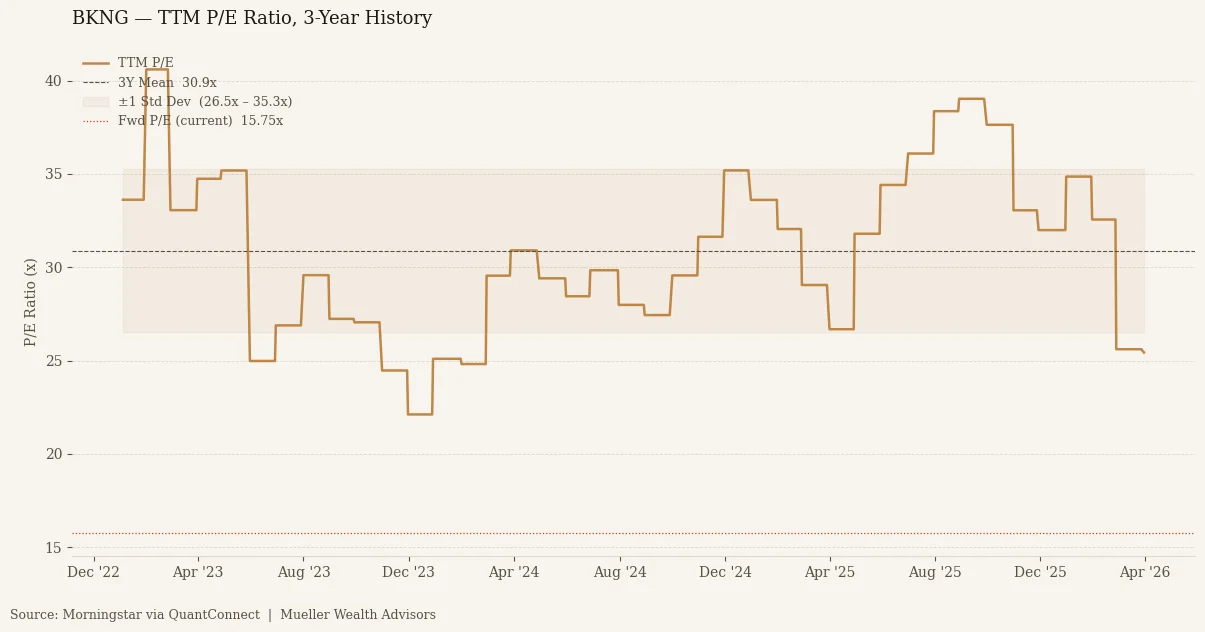
| Booking Holdings | BKNG | 25x | 15.75x | 0.71 | FCF yield 6.6%, margins 32% |
BKNG deserves specific attention. At a forward P/E of 15.75x on trailing revenue growth of 13% and operating margins of 32%, it is the cheapest name in the group on an earnings basis and arguably the highest-quality cash generator. A PEG ratio of 0.71 means the market is not pricing the growth — it is discounting it. EV/EBITDA of 14.7x and a free cash flow yield of 6.6% anchor the valuation from an enterprise value standpoint. For an asset-light platform with structural tailwinds in global travel demand, that setup appeared constructive relative to the broader selloff.
Select Equity rotated tactically into Technology in March after running approximately 10% underweight heading into the selloff — well-timed given the volatility and the subsequent stabilization in quality tech names.
Our macro view heading into Q2 is unchanged: small caps, value, and equal-weight constructions are better positioned than mega-cap growth. The Russell 2000 Value is the top-performing major benchmark YTD at +4.9%. That is not noise — it reflects a market beginning to price a rotation away from the handful of names that dominated 2023 through 2025.
Three catalysts could accelerate that rotation meaningfully: an Iran resolution unwinding the geopolitical risk premium in energy, fiscal stimulus directed at domestic manufacturing or infrastructure, and a more accommodative signal from the Fed. Banks, Industrials, Homebuilders, and Small Cap are all positioned to benefit from any combination of those outcomes. We hold exposure to all four in Tactical, with expression in G&I and Select Equity as well.
The core held in Q1. What we did around it — trimming energy at the top, adding software at the bottom, and staying long the domestic cyclical rotation — reflects the active positioning this strategy is designed to execute. Q2 will either confirm the setup or force a re-evaluation. We have defined levels for both.