
We ran 44 earnings events across five mega-cap tech names — NVIDIA, Meta, Amazon, Alphabet, and Microsoft — covering every quarterly report from Q1 2024 through Q4 2025. Capex and EPS figures from public filings. The question was simple: does beating earnings actually move these stocks higher?
The answer, quantified: no.
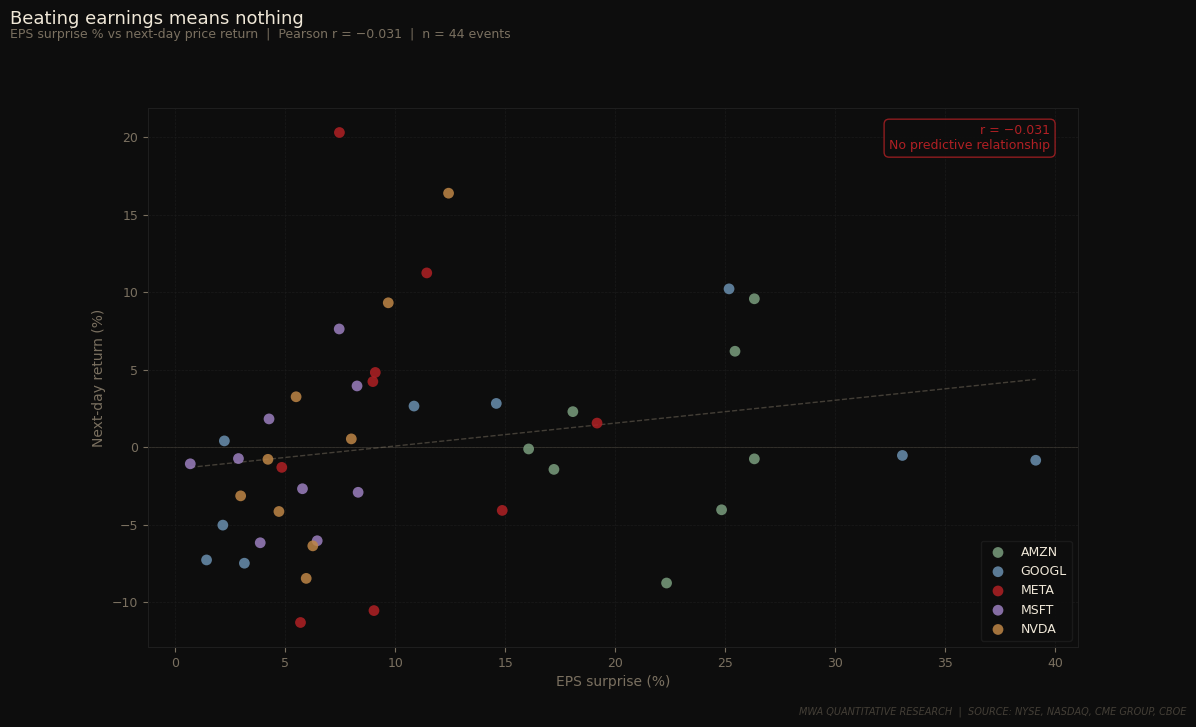
Pearson r = −0.031. Beating earnings by 5% or 25% has zero predictive power on next-day returns for mega-cap tech.
That number is not weak — it is statistically indistinguishable from random. Across 44 events, the magnitude of the EPS beat explains nothing about what the stock does the following day. A company that crushes consensus by 39% (Alphabet, April 2025) can close down. A company that beats by 3% can rip 20%. The reported number has been decoupled from the price reaction entirely.
This is not a recent anomaly. The pattern has been building for six quarters. What changed is what the market is actually pricing. For most of the post-2020 cycle, investors bought reported growth. Strong EPS, stock goes up. That relationship held because the primary question was whether these businesses were compounding. That question has been answered — they are. The new question is whether the capital being deployed to sustain that compounding will generate returns. That question does not get answered on earnings day. It gets answered two to three years from now, when AI infrastructure spend either produces proportionate revenue or it doesn't.
Every earnings call has become a capital allocation confession. Management teams report the quarter, then announce how much more they intend to spend. The market is discounting those commitments in real time.
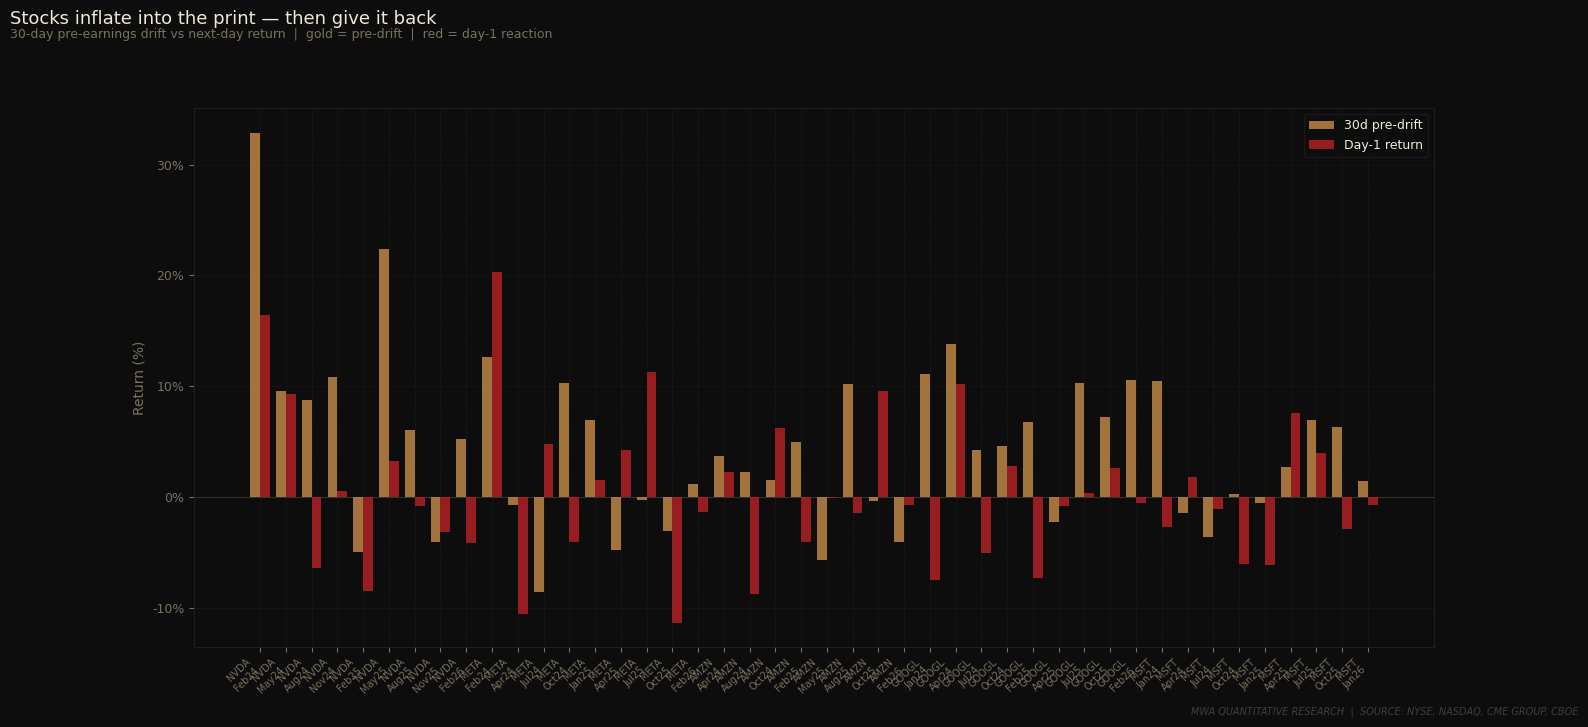
The second chart tells the mechanical story. Stocks inflate into the print — often 8% to 15% over the 30 days preceding the report — then sell on the result regardless of beat magnitude. The pre-earnings drift correlation with next-day returns is r = +0.35, the only variable in our study with meaningful signal. Stocks that run hard into earnings give back more. The inflation is the setup for the reversal.
The third variable we tested was capex guidance. Hypothesis: the larger the spending commitment announced on the call, the worse the stock reaction. Pearson r = −0.043.
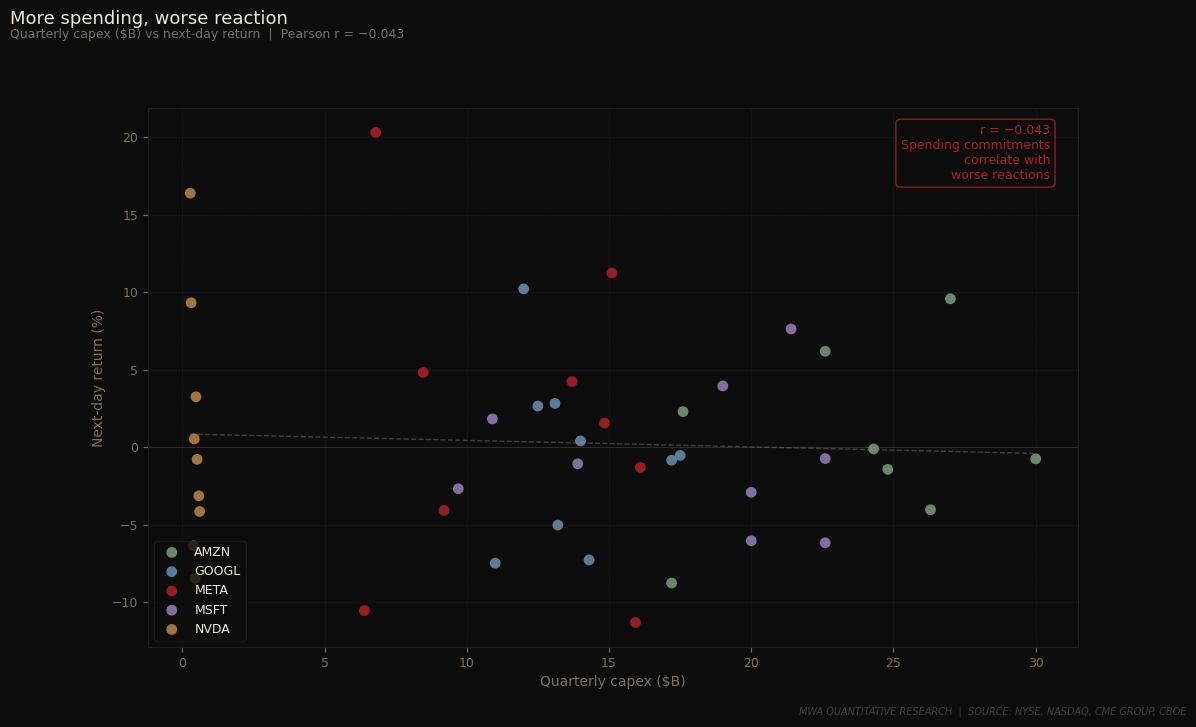
Again near-zero, again slightly negative. Alphabet's Q4 2025 is the cleanest example: revenue of $113.8B against a $111.4B estimate, Cloud crushing expectations, EPS of $3.10 against a $2.33 consensus — a 33% beat. Stock closed down on $175–185B in announced 2026 capex. Amazon's Q4 2025 told the same story: EPS of $1.68 against $1.33 estimated, a 26% beat, stock down 5.5% on $200B in projected infrastructure spend. Meta has done this repeatedly — beaten on revenue and EPS in consecutive quarters while the stock sold off on AI infrastructure commitments now running above $16B per quarter.
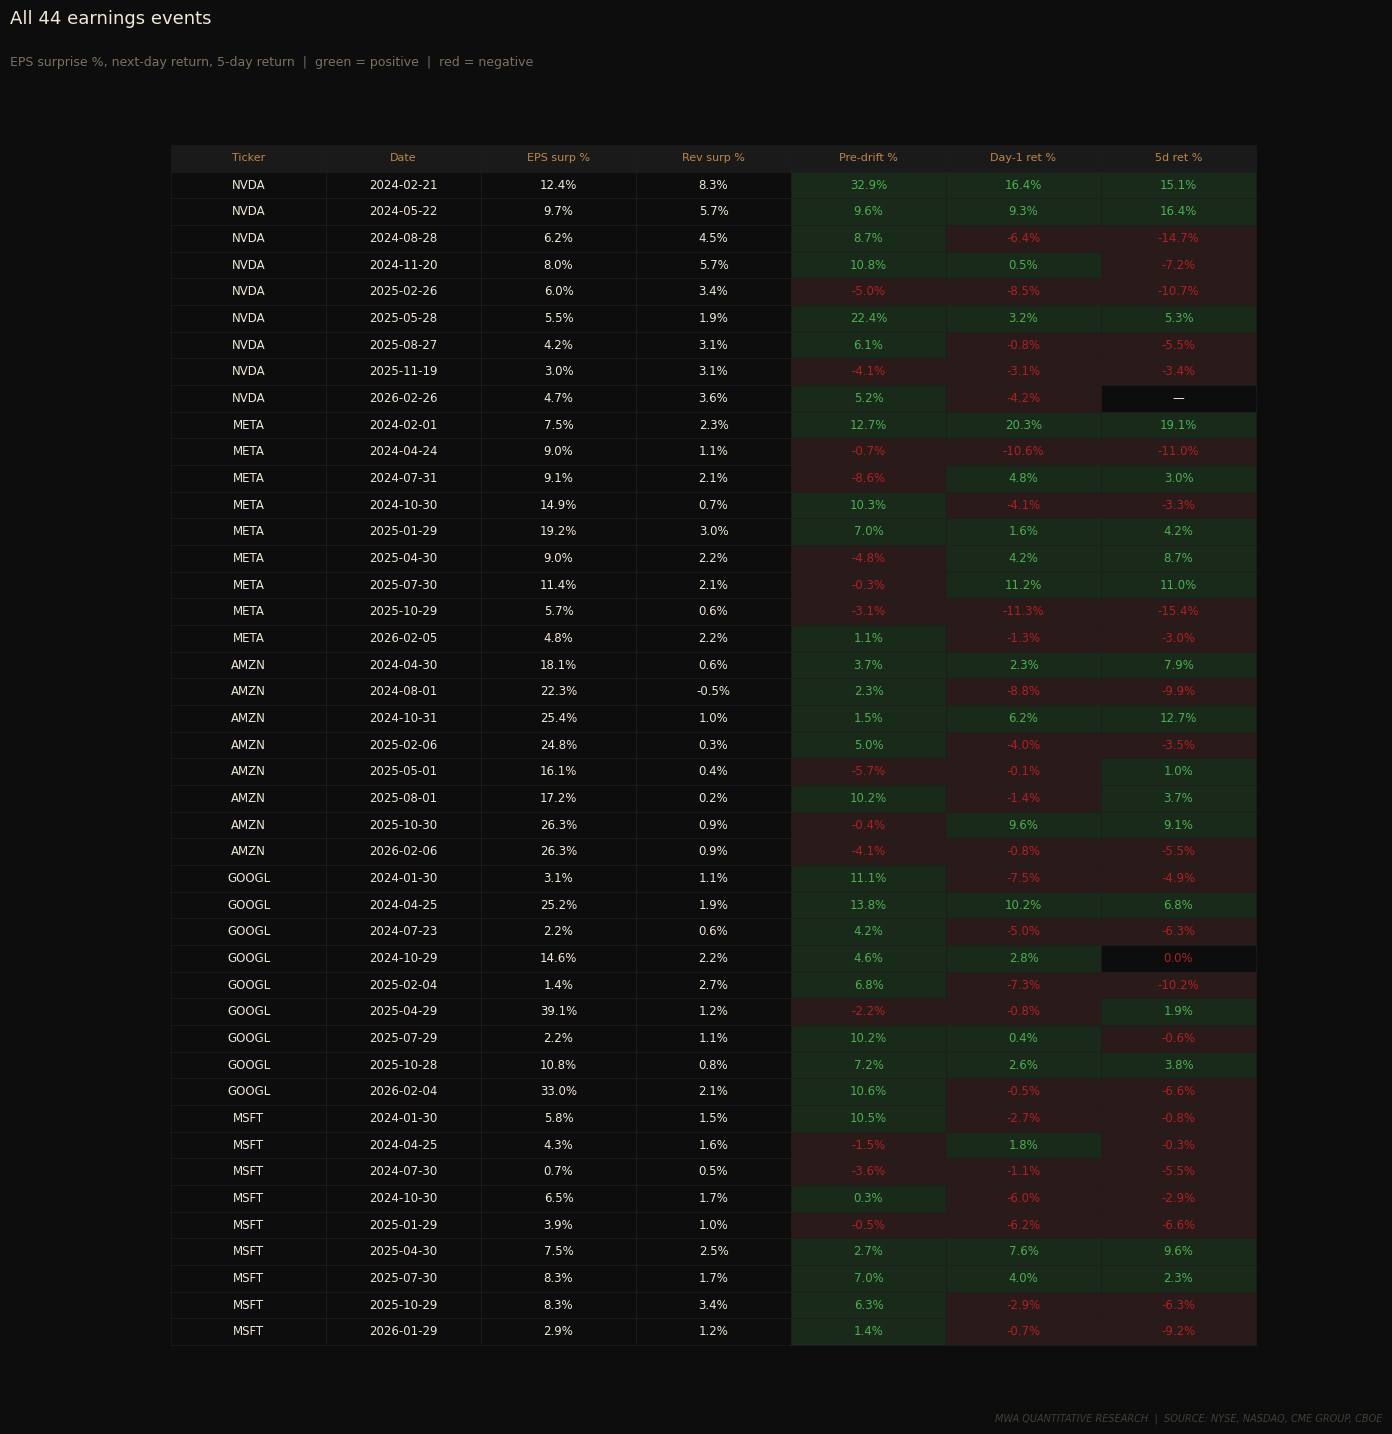
The full event table makes the dispersion visible. There is no column you can sort by that cleanly separates green from red in the return columns. Beat size, revenue surprise, capex level — none of it organizes the outcomes. What does appear in the 5-day return column is that negative reactions tend to compound. Of the events where day-1 return was negative, the majority were also negative at day 5. The selling is not mean-reverting in the short term for this group.
Going into Q1 2026 reporting — Goldman Sachs on April 13, then JPMorgan, Wells Fargo, and Citi on April 14 — this dynamic carries a second invalidation vector: tariffs. Capex assumptions across every hyperscaler were built in a free-trade environment. Hardware costs for data center buildout, networking equipment, and semiconductors are now structurally higher. Management teams will face a dual confession on every call: here is what we are spending on AI, and here is what tariffs are doing to that number.
The companies that outperform post-earnings this cycle will not be the ones with the largest beats. They will be the ones that can show AI revenue already being generated — measurable workload revenue tied to infrastructure already deployed. Alphabet's Cloud segment is the cleanest expression of this. When Google Cloud prints AI-driven revenue acceleration with specific contract wins and API consumption metrics, the market responds. When the story is future spend, it does not.
Within our tactical allocation sleeve, we are approaching Q1 2026 reporting with reduced exposure to names where the AI revenue/capex ratio remains wide and pre-earnings drift has been significant. The setup — meaningful run-up into the print, unresolved capex ROI question, tariff overlay on hardware costs — is not one where we want to be long into the announcement. This strategy is implemented selectively based on individual client objectives and risk tolerance. Not all clients participate in this sleeve.
The market has stopped grading on the curve. Beating the number is table stakes. Proving the spend is working is the only question that moves these stocks now.
The invalidation is specific. If Q1 reports show clear AI monetization — Copilot seat growth translating to Azure revenue acceleration, AWS AI workload revenue breaking out as a disclosed line item, Google Cloud AI contract wins appearing in recognized backlog — the market could re-rate the capex as productive rather than speculative. That would restore a positive EPS surprise correlation and change the posture entirely. We will be watching those disclosures, not the headline beat.
The data from the last six quarters says that moment has not arrived yet.